Amazon Advertising
Amazon Prime Day 2026 Results: A Data-Driven Breakdown for Sellers
Across 16 managed brands, Incrementum Digital saw Prime Day 2026 generate $3.79M in daily revenue against a $2.29M same-day-last-week baseline — a 66% revenue lift with orders up 84%. The event delivered. But the aggregate number is the least useful part of the analysis.

Learn How to Make Listings That Convert in 2025!
Read our step-by-step guide on how to optimize your listings using Rufus AI insights. Sign up for our newsletter and get your copy for free!
Show me howPrime Day 2026 ran June 23–26, the second consecutive four-day format. It was also the second year where Walmart and Target ran concurrent promotional events, where consumer confidence sat near historic lows, and where tariff-driven cost increases had already worked through household budgets. The shoppers who showed up arrived with a list, a ceiling, and very little patience for marginal deals.
This post breaks down who that shopper was, what changed in 2026, how advertising efficiency shifted across the four days, which categories and brand tiers performed best, and what the data points to for 2027 planning. All performance figures come from Incrementum-managed account aggregates. Shopper behavior data comes from Numerator’s 2026 Prime Day Verified Buyer Survey (5,002 respondents, final read 6/26/26).
Key takeaways
- Prime Day 2026 drove a 66% revenue lift and 84% order growth across 16 managed brands
- The typical Prime Day shopper: high-income, suburban, 45–64, 89% a repeat attendee, 93% pre-planned
- 45% of purchases were items shoppers had been waiting to put on sale — pent-up demand, not impulse
- Average order size fell to $47.66 from $53.34 in 2025, shaped by consumer confidence near a record low and tariff-driven household cost increases
- CPCs rose only 4.8% above the 30-day baseline in 2026, compared to 9.7% in 2025 — a real efficiency window for well-structured accounts
- Top-performing brands shared three traits: strong pre-event brand investment, deals structured above the 20% conversion threshold, and budget allocated across all four days
What were the Amazon Prime Day 2026 results overall?
Amazon Prime Day 2026 ran June 23–26 across 200+ countries and represented the largest summer shopping event on Amazon’s calendar. Across Incrementum’s 16 managed brands, the event produced $3.79M in daily revenue on Day 1 against a $2.29M same-day-last-week baseline. Order volume increased 84% over baseline, outpacing revenue growth — a signal that unit demand was strong even as average order size compressed.
Numerator tracked 178,787 verified buyer orders during the event period. Their data confirms what the account-level figures show: demand was real, pre-committed, and concentrated in specific categories. 45% of purchases were items shoppers had been actively waiting to buy until a sale event. Nearly two-thirds of households placed two or more separate orders across the four days.
That demand profile matters for how brands should plan. Prime Day 2026 functioned less as a discovery event and more as a release valve for demand that had been building since April and May.
Who actually shopped Amazon Prime Day 2026?
The typical Prime Day 2026 shopper was a high-income, suburban woman between the ages of 45 and 64. 89% had shopped a previous Prime Day. 93% knew it was Prime Day before placing a single order.
This is not a broad consumer sweep. Prime Day 2026 attracted a concentrated, brand-aware audience with above-average income, existing Prime membership, and high purchase intent. The shopper who showed up had already decided what she wanted — the question was whether a given brand made her short list before she opened the app.
Apparel, health and wellness, beauty, and home goods were the most purchased categories by household penetration, per Numerator. These are discretionary categories where brand recognition, reviews, and product authority drive preference. They are also the categories where Incrementum’s managed portfolio is concentrated, which shaped the portfolio results directly.
The practical implication of this profile: a brand’s Prime Day results are largely determined by the brand equity and product presence built in the 60–90 days before the event opens. The high-intent shopper arrived with a mental short list. Brand-building investment in Q2 is what gets a brand onto it.
What caused average Prime Day 2026 order sizes to fall below 2025?
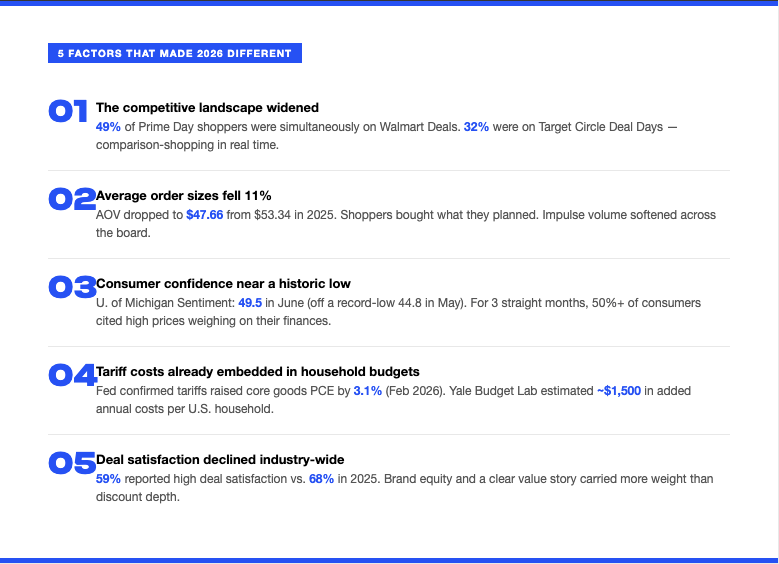
Prime Day 2026 average order size came in at $47.66, down from $53.34 in 2025. That 11% decline reflects a real shift in shopper behavior driven by five overlapping factors.
Factor 1: The competitive landscape widened. 49% of Prime Day 2026 shoppers were simultaneously browsing Walmart Deals, and 32% were on Target Circle Deal Days, per Numerator. Shoppers were not captive to Amazon’s promotional window — they were comparison-shopping across retailers in real time, which compressed the urgency that historically drove larger basket sizes.
Factor 2: Consumer confidence was near a historic low. The University of Michigan Consumer Sentiment Index closed June 2026 at 49.5, rebounding from a record low of 44.8 in May. For three consecutive months leading into Prime Day, more than half of surveyed consumers volunteered — without prompting — that high prices were weighing on their personal finances. Shoppers arrived with a real budget ceiling, not an abstract one.
Source: University of Michigan Surveys of Consumers, June 2026 final reading
Factor 3: Tariff-driven cost increases had already hit household budgets. The Federal Reserve confirmed in April 2026 that tariffs implemented through late 2025 raised core goods PCE prices by 3.1% through February 2026, with price pass-through described as “effectively complete.” Yale’s Budget Lab estimates the cumulative burden added approximately $1,500 in annual costs per U.S. household entering 2026. For a shopper in apparel, home goods, or electronics, that pressure was already priced in before Prime Day opened.
Sources: Federal Reserve FEDS Notes (April 2026); The Budget Lab at Yale University
Factor 4: Deal satisfaction declined industry-wide. 59% of Prime Day 2026 shoppers reported high satisfaction with deals, compared to 68% in 2025. The bar for what registers as a compelling offer has moved. Shallow discounts without strong brand equity behind them converted at lower rates.
Factor 5: Real consumer spending growth slowed. Real consumer spending is projected to grow 2.1% in 2026, down from 2.7% in 2025, per BEA data. Shoppers bought what they had planned. Unplanned additions to cart were softer across the board.
Source: U.S. Bureau of Economic Analysis, Personal Income and Outlays, May 2026
| Factor | 2025 Benchmark | 2026 Reading |
|---|---|---|
| Average order size | $53.34 | $47.66 |
| High deal satisfaction | 68% | 59% |
| U. of Michigan Sentiment (June) | ~69 | 49.5 |
| Core goods PCE increase (Fed) | Baseline | +3.1% |
How did Prime Day 2026 advertising performance compare to 2025?
Prime Day 2026 CPC inflation was meaningfully softer than 2025. CPCs across Incrementum’s managed portfolio rose 4.8% above the 30-day baseline during the event, compared to 9.7% in 2025. For well-structured accounts, that gap in auction pressure translated directly into efficiency gains.
The front-load and retarget framework worked. The event ran in four distinct phases:
- Day 1 (June 23): Highest order velocity of the event. Pre-committed shoppers with items already in cart converted immediately. Sponsored Products drove the bulk of revenue. Heavy front-loading of budget was appropriate here.
- Day 2 (June 24): Cart-adders from Day 1 converted. Retargeting campaigns — Sponsored Display and DSP audiences — became the high-priority lever. Accounts that had budget allocated specifically for Day 2 retargeting captured orders that Day-1-only strategies missed.
- Day 3 (June 25): Mid-event plateau. CPC pressure increased as competitor budgets renewed. Efficient spend allocation became critical. Over-budgeted Day 1 campaigns that had exhausted spend by Day 3 created a false efficiency signal.
- Day 4 (June 26): Cart-conversion day. Shoppers who had added items on Days 1–3 returned to complete purchases before the event closed. Retargeting and Sponsored Brands performed disproportionately well relative to spend.
One metric to interpret carefully: post-event ACoS. When campaigns exhaust their daily budgets and spend drops to zero, ACoS can look artificially low or even zero for the hours those campaigns were dark. A post-Prime Day report showing improved ACoS may reflect budget exhaustion rather than genuine efficiency. True performance analysis requires comparing intended daily budget against actual spend, then calculating efficiency on the spend that actually ran.
Sponsored Brand Video consistently outperformed standard Sponsored Brands across the portfolio. For the high-income, brand-aware Prime Day audience, video closed at higher rates on known products and built meaningful top-of-funnel recognition for new entrants to the category.
Which product categories saw the strongest Prime Day 2026 results?
Across Incrementum’s 16 managed brands, three tiers emerged based on revenue lift over same-day-last-week baseline.
Tier 1 (100%+ lift): A natural hair color brand (+280%), a travel lifestyle brand (+113%), and an organic mattress brand (+105%) each more than doubled baseline revenue. These brands shared a common profile: strong category demand, defensible brand differentiation, deals structured at or above the 20% discount threshold that research associates with doubled purchase likelihood, and pre-event Sponsored Brand Video and DSP investment that primed their audience before June 23.
Tier 2 (36–58% lift): Home fragrance, premium pet, travel accessories, oral care, bath and personal care, and premium skincare brands all performed in a consistent 36–58% lift range. These are high-intent categories where the Prime Day shopper profile overlaps closely with the brands’ core customer. Category concentration in premium, health-adjacent, and personal care was a structural advantage.
Tier 3 (19–28% lift): Premium apparel, bedding, specialty farm, and consumer products brands delivered real lifts but at the lower end of the portfolio range. The constraints varied by brand: some faced softer category demand during the event window, others entered without the pre-event brand investment that Tier 1 brands had made, and some operated in categories where competing promotional events drew traffic away from Amazon.
The pattern across all three tiers: category placement mattered, but the gap between Tier 1 and Tier 3 within similar categories came down to two variables — pre-event brand investment and deal structure. Brands that entered Prime Day as a recognized name in their category with a deal above the conversion threshold outperformed brands that ran the same deal depth without the brand foundation underneath it.
What do Prime Day 2026 results mean for 2027 planning?
Prime Day 2026 confirmed that preparation — not event-week execution — is the primary lever. Five adjustments are worth building into 2027 planning now.
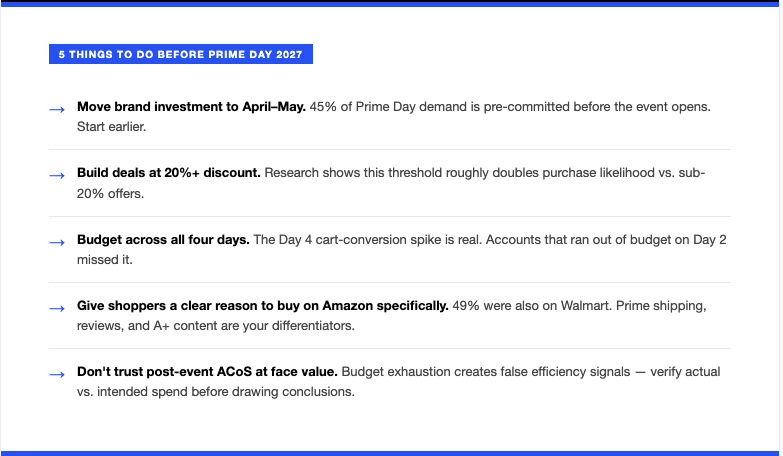
1. Move brand investment earlier on the calendar. 45% of Prime Day purchases were items shoppers had been planning to buy at a sale. That pre-committed demand is shaped weeks in advance by Sponsored Brand Video campaigns, DSP prospecting, and full-funnel brand awareness. Brands that allocate meaningful ad budget in April and May for Prime Day-adjacent audiences will arrive at the event already on the short list. Brands that start in June are working against an audience that has largely already decided.
2. Engineer deal structure, not just discount depth. Deal satisfaction fell to 59% in 2026 from 68% in 2025. Shoppers are harder to impress. Two research-backed principles apply here: a discount of 20% or more roughly doubles purchase likelihood compared to sub-20% offers; and on items priced under $100, a percentage discount reads as larger than the equivalent dollar-off framing. On items over $100, the dollar figure lands harder. Deal structure and framing are conversion mechanics, not afterthoughts.
3. Allocate budget across all four days, not just Day 1. The cart-conversion dynamic on Day 4 is real and repeatable. Accounts that depleted budget by Day 2 or 3 missed Day 4 conversions from shoppers who had been building intent throughout the event. A four-day budget allocation model, with retargeting budget specifically reserved for Days 2–4, is structurally more efficient than front-loading everything.
4. Build an explicit multi-retailer positioning. 49% of Prime Day shoppers were on Walmart simultaneously. For brands with Amazon-only presence, that comparison-shopping behavior means Prime Day deals need a clear reason to convert on Amazon specifically: Prime shipping, review density, A+ content, and bundled configurations that are not available elsewhere.
5. Audit post-event ACoS carefully before drawing conclusions. Budget exhaustion creates misleading efficiency signals. Before treating a post-Prime Day ACoS report as confirmation that ad strategy worked, verify that daily campaign budgets were not exhausted mid-day. The Amazon advertising audit process we use with new accounts applies directly to post-Prime Day analysis.
What to do next
If you want a detailed breakdown of your own Prime Day 2026 performance — what drove the lift, where spend was lost to budget exhaustion, and what to build into your Q4 and 2027 Prime Day strategy — that review starts with a look at your actual account data.
Related reading:
- How to read your Amazon TACoS and what it’s actually measuring
- What a real Amazon advertising audit covers
- How Sponsored Brand Video fits into a full-funnel Amazon strategy
Get a free review of your Amazon account: We’ll look at your Prime Day performance, your current campaign structure, and where the biggest leverage points are heading into Q4. No generic report — a real look at your account.
Request your free Amazon account review
Incrementum Digital is a full-service Amazon agency managing advertising, operations, and growth strategy for consumer brands from seven to nine figures in annual Amazon revenue. Learn more about how we work.
Data sources: Incrementum Digital managed account aggregates, Prime Day 2026 (June 23–26); Numerator Prime Day 2026 Verified Buyer Survey (5,002 respondents, final read 6/26/26); University of Michigan Surveys of Consumers, June 2026 Final Reading; Federal Reserve FEDS Notes, “Detecting Tariff Effects on Consumer Prices in Real Time – Part II” (April 2026); The Budget Lab at Yale University, “Tracking the Economic Effects of Tariffs”; U.S. Bureau of Economic Analysis, Personal Income and Outlays, May 2026.


LET’S DISCOVER WHAT’S POSSIBLE FOR YOUR BRAND
We’re here to listen and uncover opportunities tailored to your unique goals.
Fill out the form to get started, and you’ll walk away with real insights and actionable recommendations—whether we work together or not.
- HANDS-ON LEADERSHIP
- AWARD-WINNING PARTNERSHIPS
- CUSTOM-BUILT SOLUTIONS