Amazon Advertising
BFCM 2023: Our Official Amazon Advertising Performance Analysis

As we close the chapter on Black Friday and Cyber Monday for 2023, it’s time to reflect on the performance of our campaigns. Let’s take a deep dive into each key metric and compare the results with those of 2022.

Learn How to Make Listings That Convert in 2025!
Read our step-by-step guide on how to optimize your listings using Rufus AI insights. Sign up for our newsletter and get your copy for free!
Show me howTotal Sales
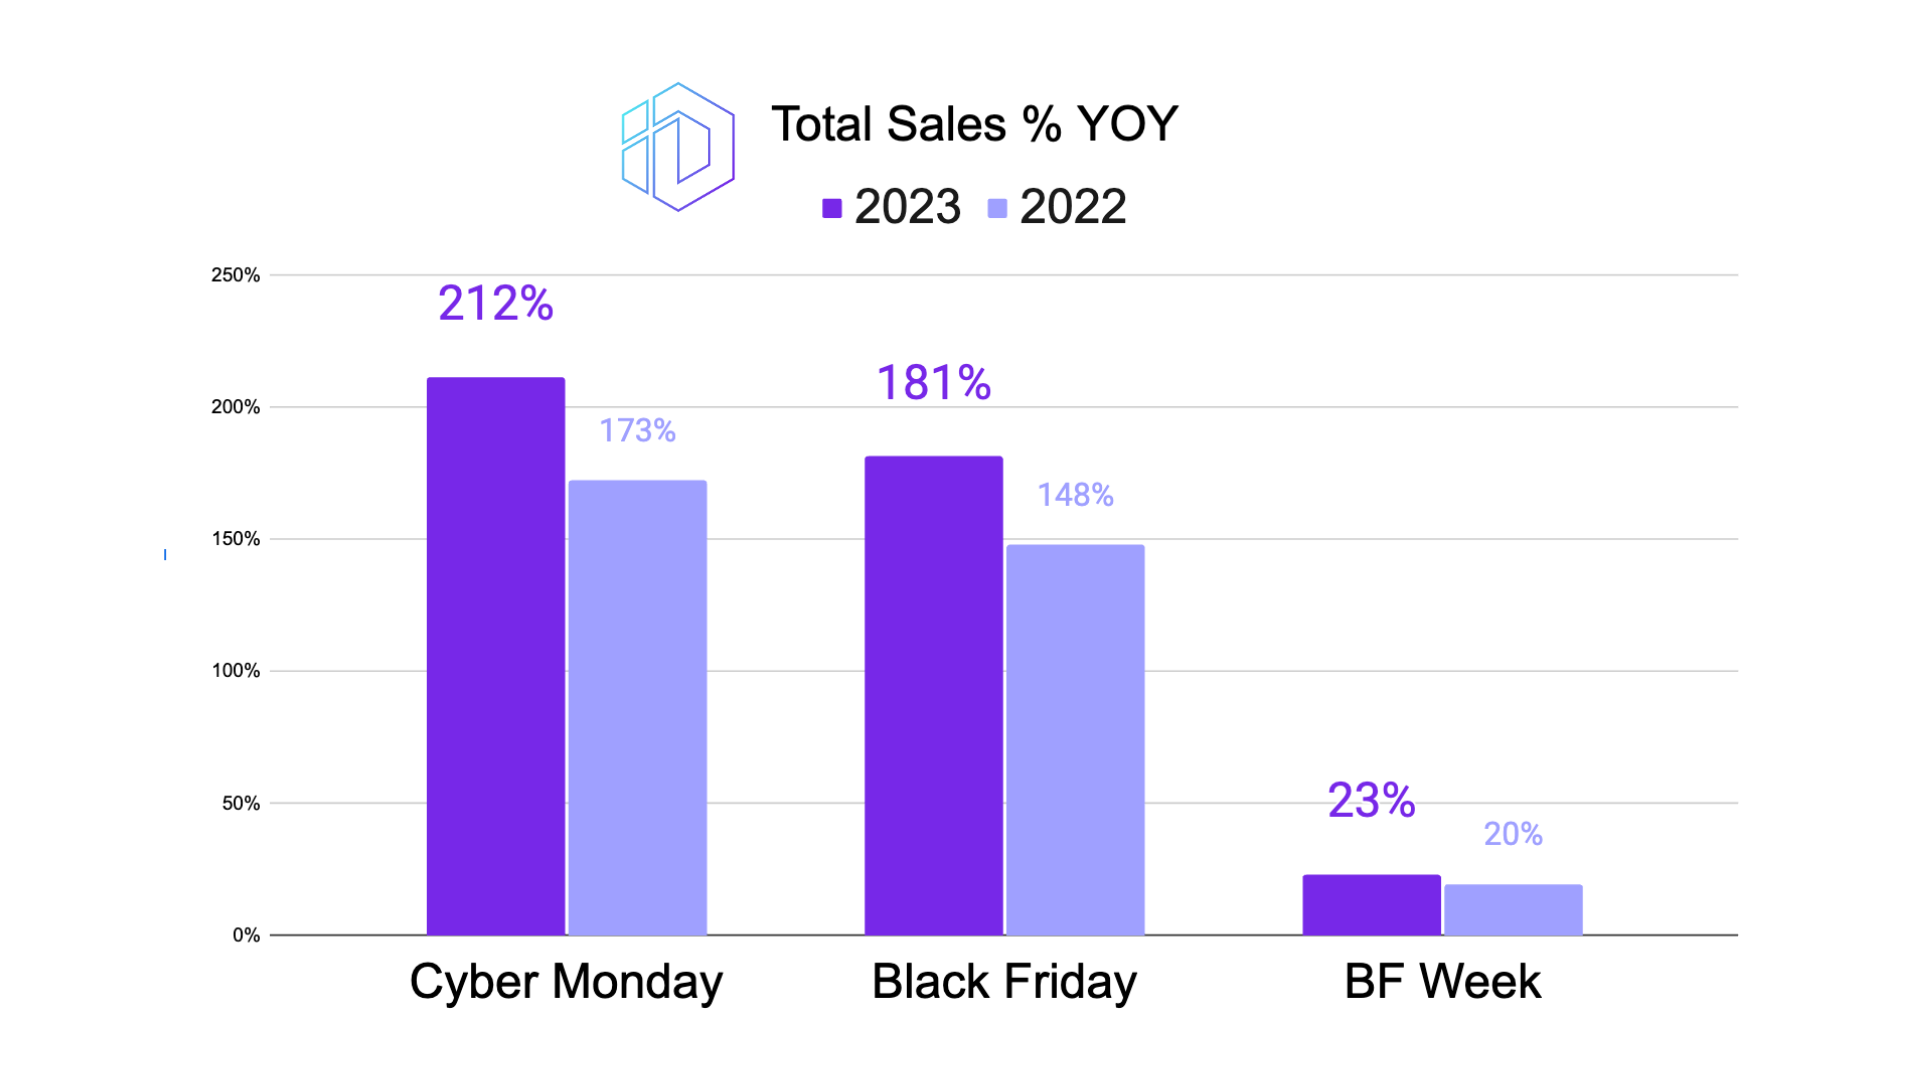
The 2023 campaigns were a resounding success in terms of total sales. On Cyber Monday, we witnessed a substantial 212% increase compared to 173% in 2022, showcasing a significant boost in consumer spending. Black Friday followed suit with an impressive rise from 148% in 2022 to 181% in 2023, reflecting a strong consumer response. During BF Week, the total sales grew by a more modest margin, from 20% in 2022 to 23% in 2023, setting a solid foundation for the main events. Interestingly, the Average 30-Day Pre BF Week saw no change from the previous year, remaining steady at 0%, which indicates a consistent pre-event performance year over year.
ACoS (Advertising Cost of Sale)
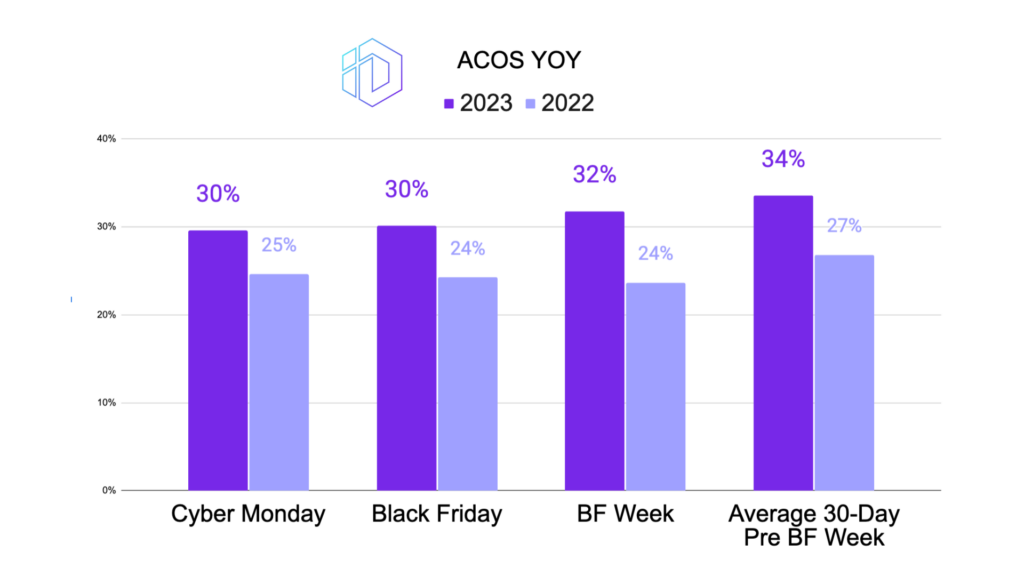
In 2023, the ACoS for Cyber Monday showed an increase, moving from 25% in 2022 to 30%, suggesting a higher investment in advertising to drive sales. Black Friday also saw a similar pattern, with ACoS rising from 24% to 30%. During BF Week, ACoS climbed slightly from 24% to 32%, indicating a strategic increase in ad spending. In the Average 30-Day Pre BF Week, ACoS increased from 27% to 34%, likely reflecting an early-stage investment in advertising for the upcoming shopping events.
TACoS (Total Advertising Cost of Sale)
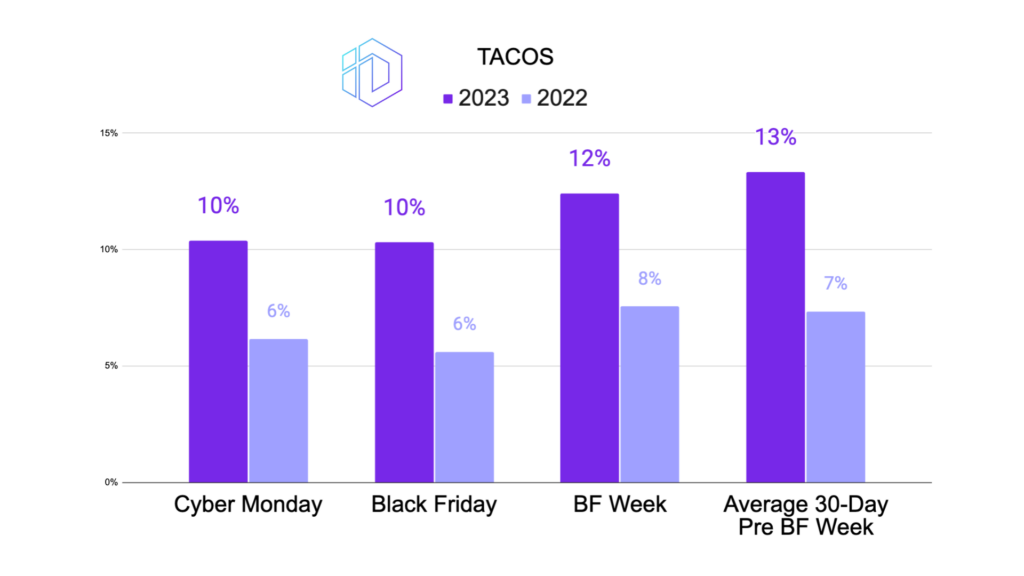
TACoS during Cyber Monday in 2023 increased marginally from 6% in 2022 to 10%, hinting at a broader investment in advertising relative to overall revenue. This trend was consistent on Black Friday and throughout BF Week, with TACoS rising from 6% to 10% and 8% to 12%, respectively. In the Average 30-Day Pre BF Week, TACoS also saw an increase from 7% to 13%.
CPC (Cost Per Click)
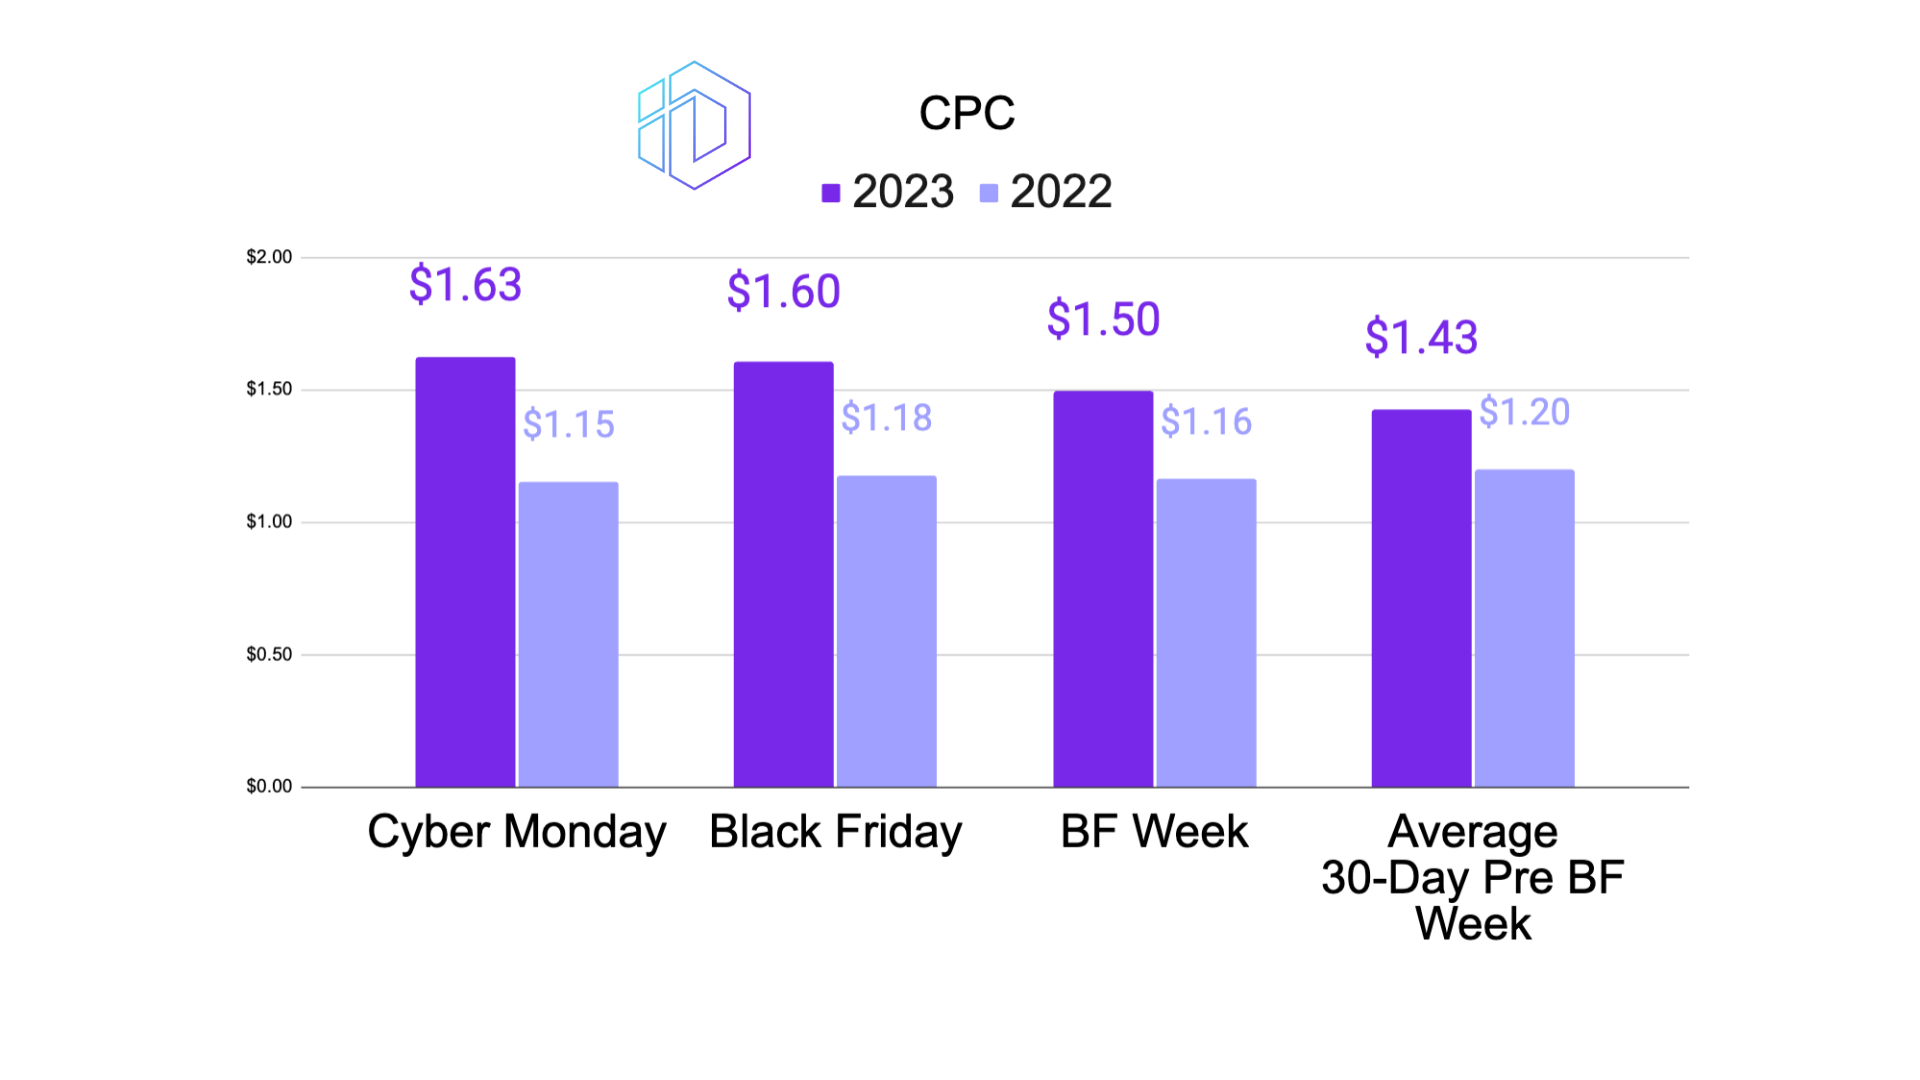
During Cyber Monday, CPC increased from $1.15 in 2022 to $1.63 in 2023, indicating a higher cost to engage potential customers, likely due to more competitive ad bidding. Black Friday also saw a rise in CPC, moving from $1.18 in 2022 to $1.60 in 2023, suggesting a similar competitive advertising environment. Throughout BF Week, the CPC climbed from $1.16 to $1.50, reflecting a broader trend of increased ad costs leading up to major shopping events. Interestingly, in the Average 30-Day Pre BF Week, the CPC trend was slightly different, with an increase from $1.20 in 2022 to $1.43 in 2023. This gradual rise in CPC over the month leading up to Black Friday indicates a ramping up of advertising efforts and market competition as the event approached.
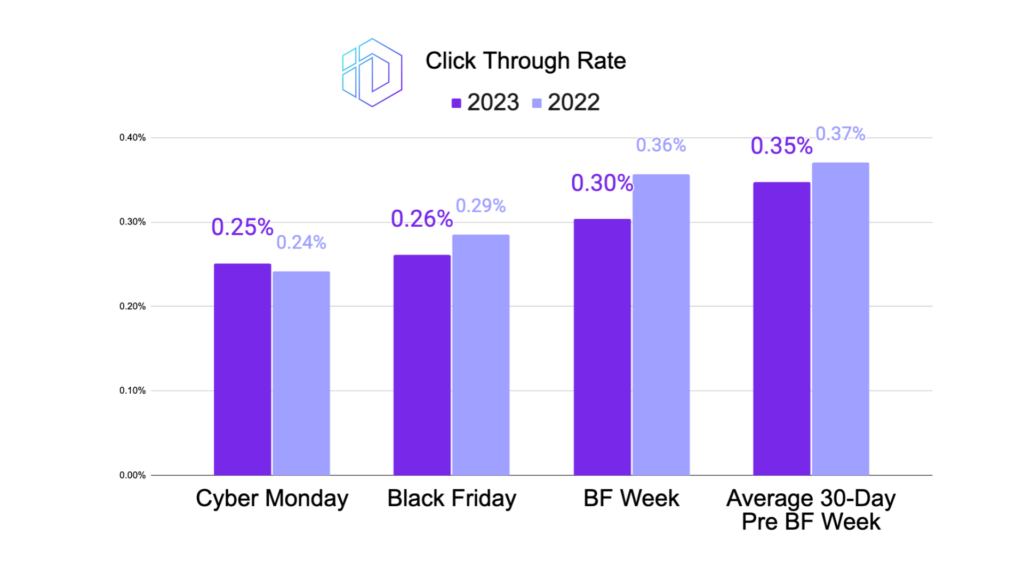
CTR (Click-Through Rate)
The CTR during Cyber Monday improved slightly in 2023, moving from 0.24% to 0.25%, indicating more effective ad engagement. Black Friday also witnessed a similar increase in CTR, going from 0.29% in 2022 to 0.26% in 2023. During BF Week, the CTR improved from 0.36% to 0.30%, and in the Average 30-Day Pre BF Week, it remained relatively stable, changing from 0.37% to 0.35%.
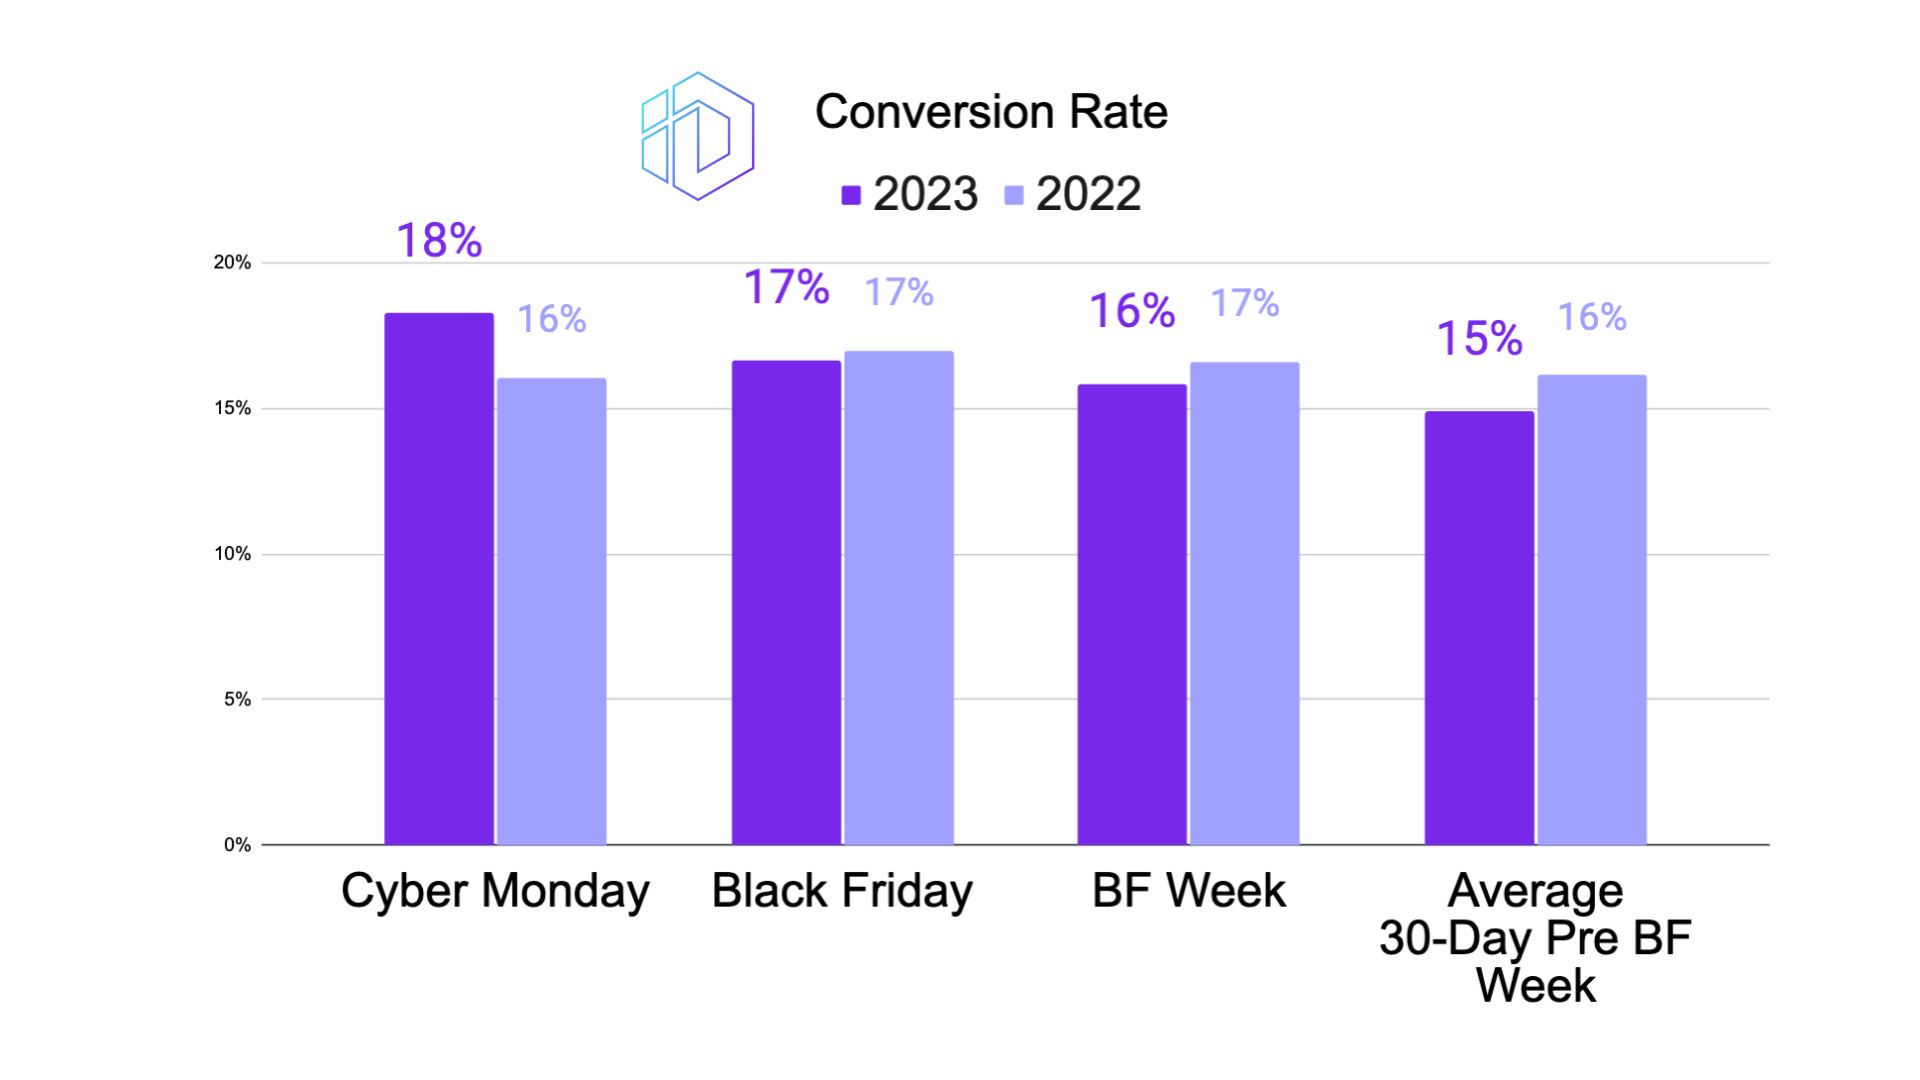
Conversion Rate (CVR)
The conversion rate on Cyber Monday increased from 16% in 2022 to 18% in 2023, showing more successful conversions from ad clicks. On Black Friday, the CVR remained stable year over year at 17%. BF Week also saw a consistent CVR, maintaining at 17% from 2022 to 2023. The Average 30-Day Pre BF Week mirrored this trend, with the CVR holding steady at 16%.
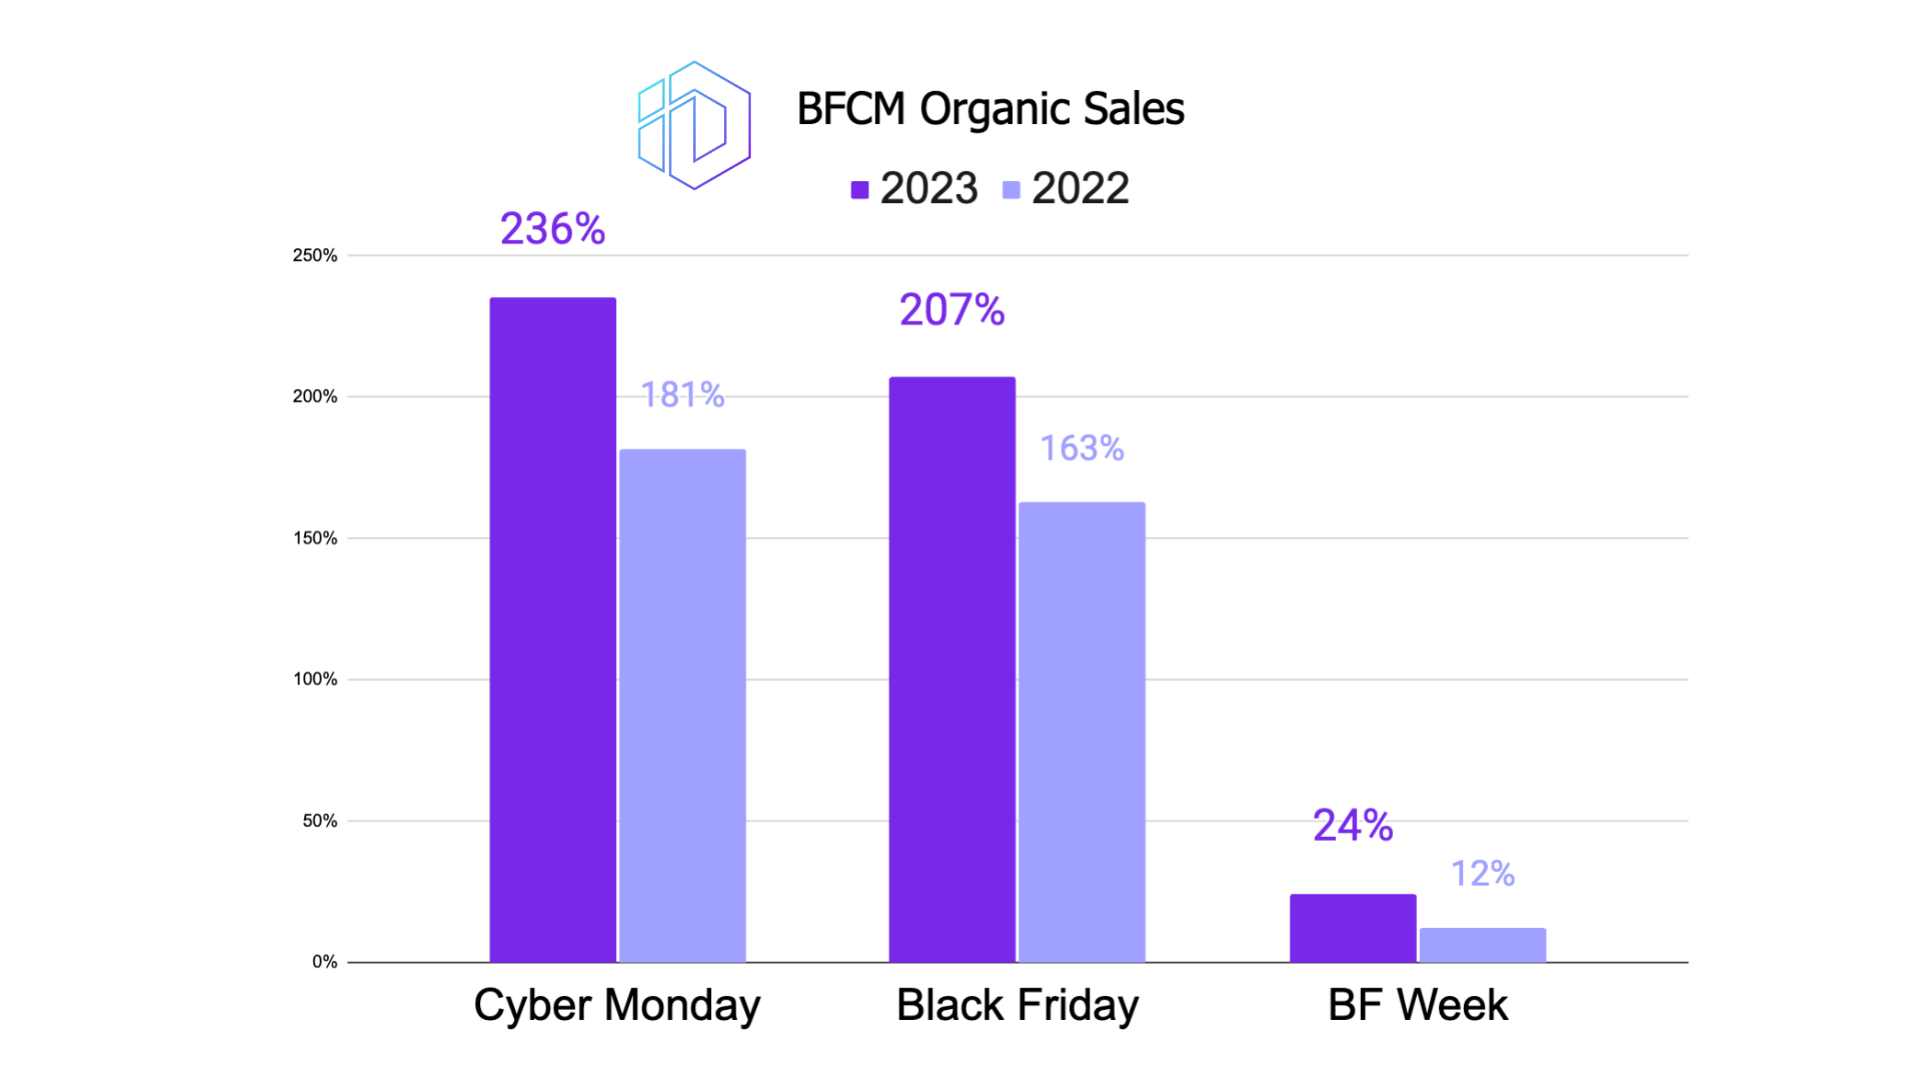
YOY Organic Sales Lift
For Cyber Monday, organic sales jumped significantly from 181% in 2022 to 236% in 2023, reflecting a stronger brand presence and customer loyalty. Black Friday saw a similar increase in organic sales, rising from 163% to 207%. During BF Week, there was a modest increase from 12% to 24%, and in the Average 30-Day Pre BF Week, organic sales remained unchanged, as expected in the lead-up phase.
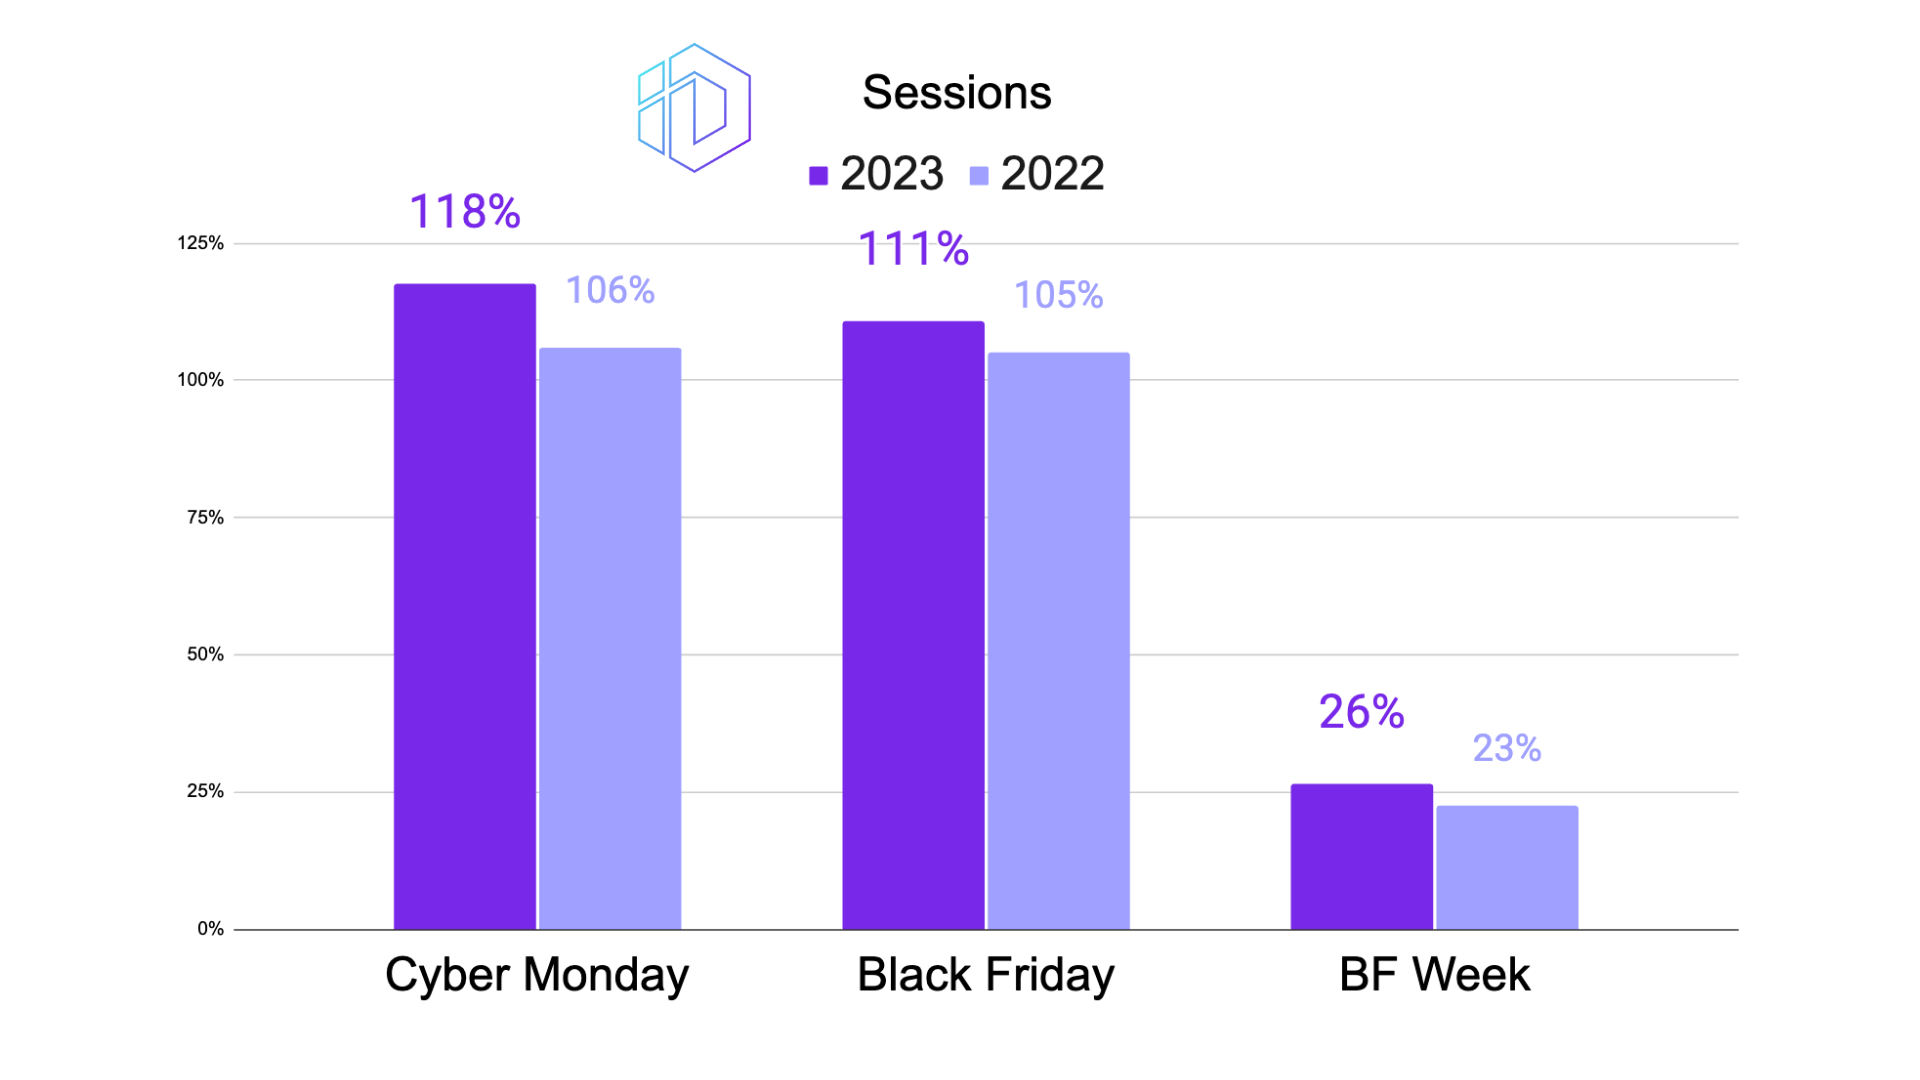
Sessions
The number of sessions on Cyber Monday increased from 106% in 2022 to 118% in 2023, indicating successful efforts in driving web traffic. Black Friday also experienced a rise in sessions, moving from 105% to 111%. During BF Week, sessions saw a growth from 23% to 26%, and in the Average 30-Day Pre BF Week, there was no significant change, remaining at 0%.
In conclusion, 2023’s Black Friday and Cyber Monday campaigns demonstrated remarkable improvements across most metrics, reflecting strategic advancements in marketing and a deeper engagement with our audience. It’s clear that our efforts in adapting to market trends and consumer behaviors have paid off.
If you found these insights valuable, don’t miss out on our Prime Times weekly newsletter! Curated by the expert team at Incrementum Digital, Prime Times is your essential guide in the world of retail media, with a special focus on Amazon advertising. Whether you’re an experienced marketer or new to the scene, subscribe now to stay ahead with the latest news, trend analyses, and practical tips. Just fill out the form below to elevate your Amazon advertising strategy to new heights!


LET’S DISCOVER WHAT’S POSSIBLE FOR YOUR BRAND
We’re here to listen and uncover opportunities tailored to your unique goals.
Fill out the form to get started, and you’ll walk away with real insights and actionable recommendations—whether we work together or not.
- HANDS-ON LEADERSHIP
- AWARD-WINNING PARTNERSHIPS
- CUSTOM-BUILT SOLUTIONS